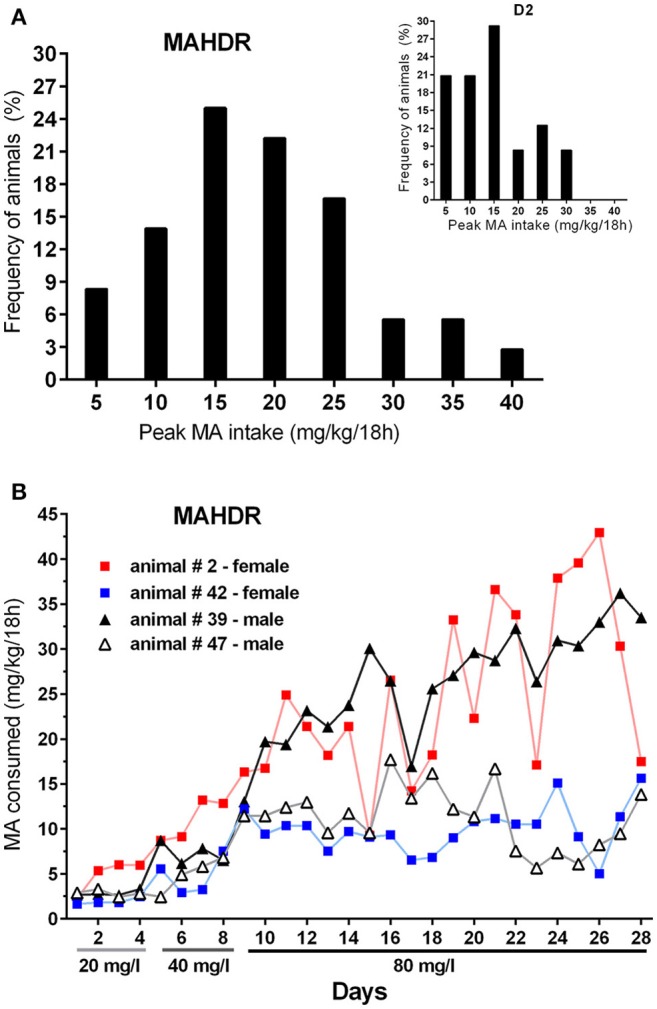
Figure 8.

MAHDR mice are variable in their peak MA intake and MA intake patterns across time. (A) Frequency of animals in bins of 5 mg/kg/18 h, with peak 80 mg/l MA intake level ≥ the value along the x-axis. The inset shows the distribution for D2 mice from Experiment 4 for comparison; (B) MA drinking patterns of 4 MAHDR mice from Group 2 of Experiment 5 illustrating variability in patterns of peaks and troughs in binge-level MA intake. Patterns for Group 2 animals are shown, because they were given daily MA access, whereas the other groups were given MA access every other day or every 3 days.
