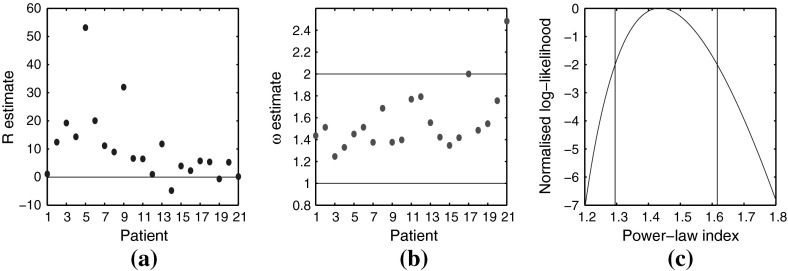
Fig. 5.
Likelihood analysis results: patients are sorted left to right by number of metastases with patient 1 having 30 mets to patient 21 having 3. Hence, values to left of figures are more significant. a Likelihood ratio for each data-set. Points above the horizontal line suggest data-set is from a power-law distribution over a geometric distribution. b Estimate for each data-set, determined via maximum likelihood. c Normalised log-likelihood function for best data-set. Vertical bars show the likelihood interval

