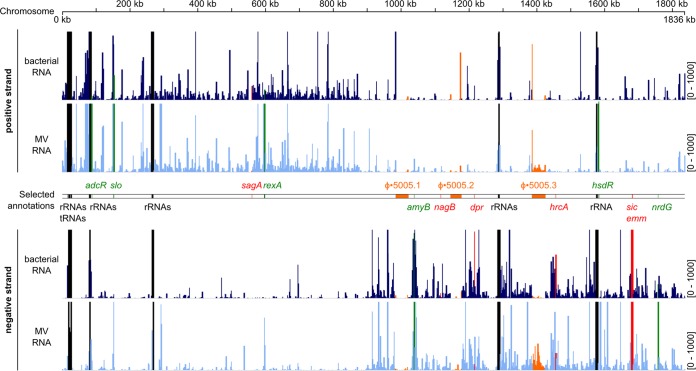
FIG 4 .
RNA species are differentially abundant between GAS cells and MVs. Coverage of reads from MVs and bacterial cellular RNAs mapped to the reference M5005 genome. Chromosomal coordinates are indicated at the top in kilobases. The scale for mapped reads is indicated to the right of the coverage map. tRNA and rRNA loci are indicated in black. The positions of prophage regions are indicated in orange. Selected RNA species more abundant in MVs are highlighted in green, and RNA species less abundant in MVs are highlighted in red. The vesicular and bacterial coverages shown are from a representative sample from biological triplicates.

