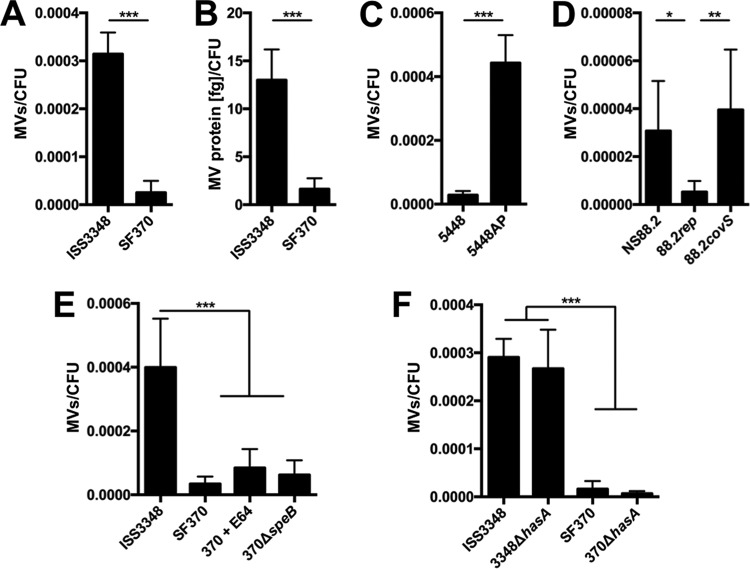
FIG 5 .
CovRS signaling impacts MV production. Shown is quantification of MV production by GAS strains on the basis of FM1-43 dye staining expressed as MVs per CFU (A and C to F) or total vesicular protein abundance estimated by Bradford protein determination expressed as femtograms of MV protein per CFU (B). Asterisks indicate statistical significance by Student’s unpaired t test (A to C) or one-way ANOVA with Tukey’s post hoc test (D to F): *, P < 0.05; **, P < 0.01; and, ***, P < 0.001. The results presented are means ± SD from 3 to 5 independent experiments, each of which was conducted with 2 technical replicates.

