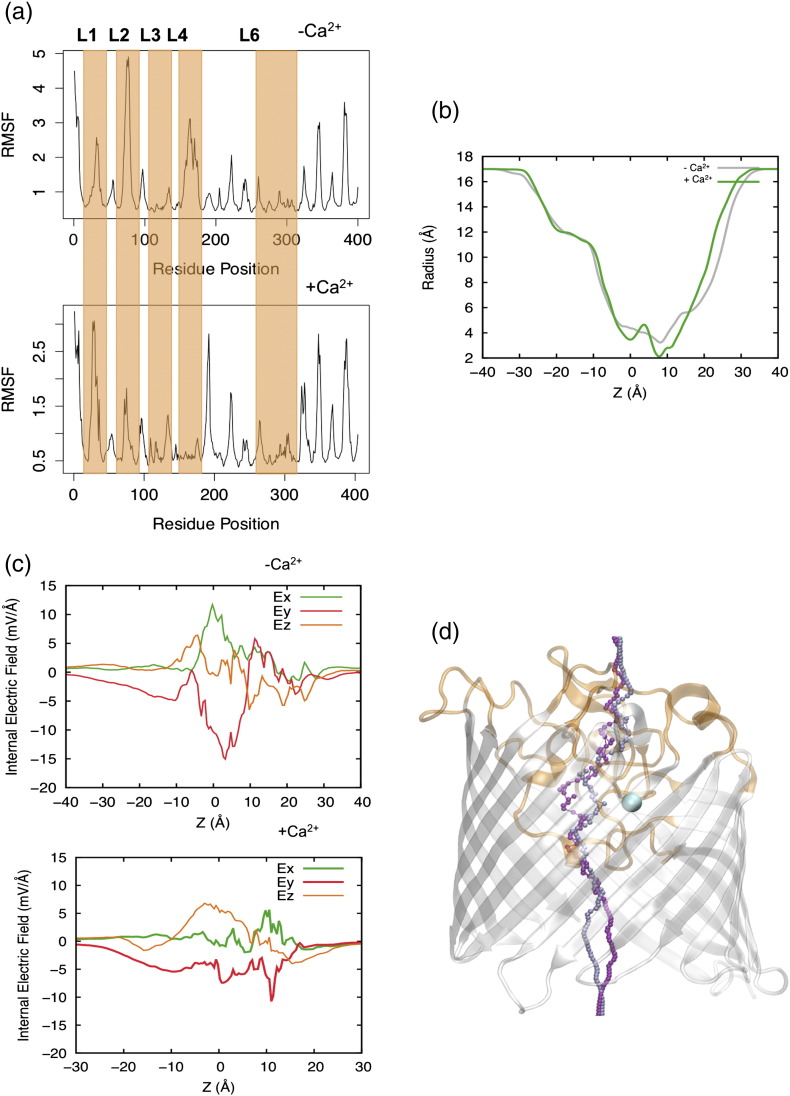
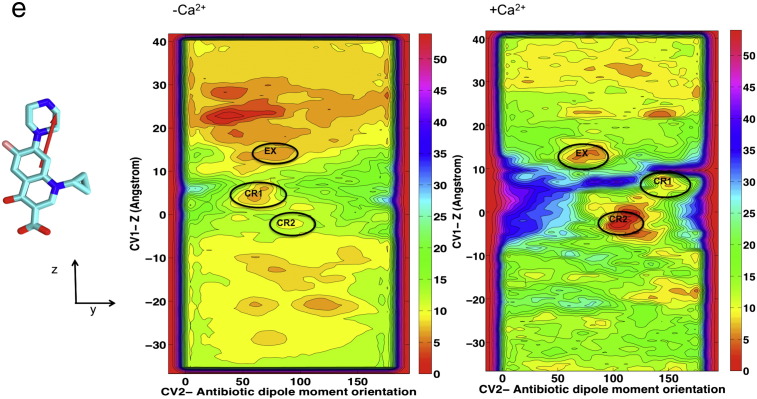
Fig. 5.
MOMP permeability. (a) RMSF of protein backbone for the two simulated structures: not Ca2 + bound and Ca2 + bound. The loops presenting bigger changes in fluctuation values are highlighted in orange. (b) The pore radius of MOMP monomer moving from the extracellular side to the periplasm without bound calcium (gray) and with bound calcium (green). (c) The macroscopic intrinsic electric field of MOMP with and without calcium. A reduction of the transversal components from ~ 18 mV/Å in the structure without calcium to ~ 7 mV/Å when calcium is present. (d) The putative pathway for water diffusion shifts toward the calcium ion when it is present (ice blue), while in the structure without calcium ion (purple), it avoids the cluster of negative residues that coordinate Ca2 +. MOMP monomer is shown in cartoon representation. (e) Free energy surface for the translocation of ciprofloxacin through MOMP without and with calcium. Antibiotic dipole moment orientation is depicted onto a licorice representation of ciprofloxacin in red. Each isocontour corresponds to a free energy difference of 2 kcal mol− 1. Free energy values were rescaled for each surface in order to have the absolute minimum equal to zero. The most relevant minima for ciprofloxacin translocation have been labeled for both scenarios: one in the extracellular region (EX) and two inside the constriction region (CR1, CR2).


