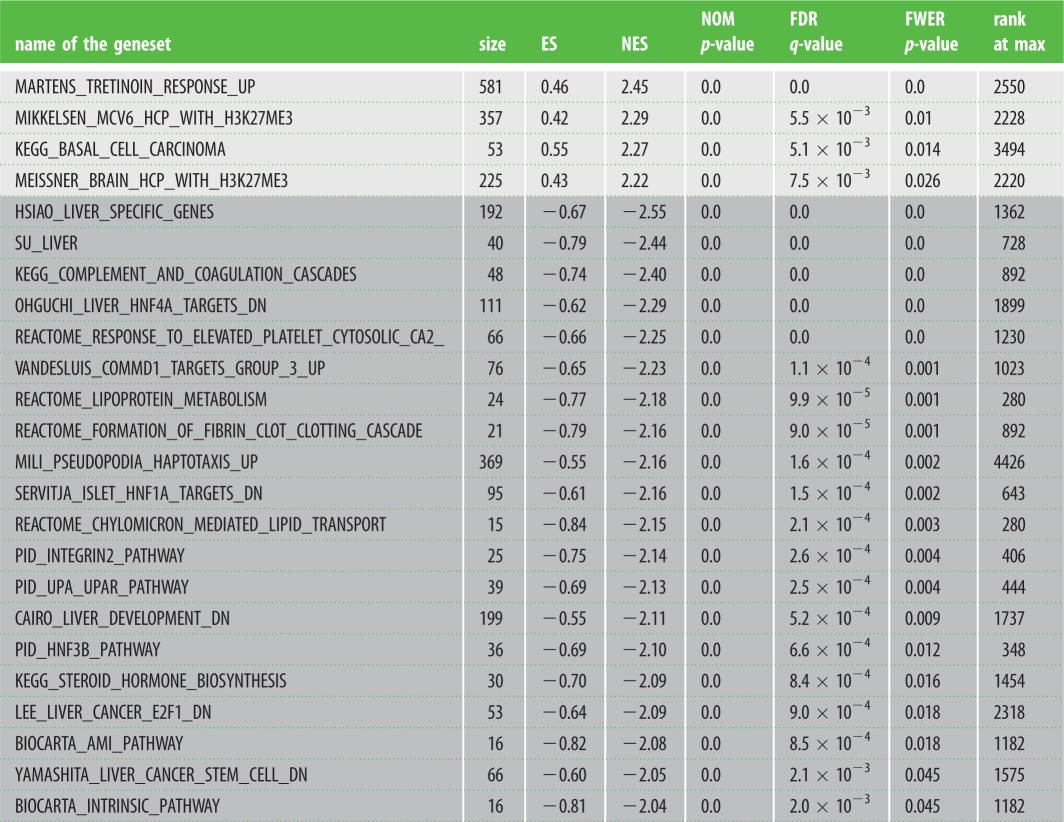
Table 1.
Highly significant placental gene sets identified as enriched between 66H-MMU13 and C57B6/J mice. The gene sets (obtained from GSEA, http://software.broadinstitute.org/gsea/msigdb/collections.jsp) were systematically tested against the placental transcriptome comparing the two mouse lines under scrutiny. When a name starts the geneset it refers to the researcher that published the dataset. Size refers to the number of genes present in the geneset. Positive values for ES and NES (light grey) stands for gene clusters of upregulated genes, while the negative values (dark grey) account for clusters of downregulated genes. NOM p-value is the nominal (non-corrected p-value). FDR is the false discovery rate and FWER is the family-wise error rate. The RANK at MAX refers to the position of the last gene inside the up- or downregulated group, among the complete classified list of genes from the microarray experiment. For instance, this means that statistically there are 2.45-fold more genes than expected in the present study that are correlated to upregulated genes following tretinoin treatment.
 |
