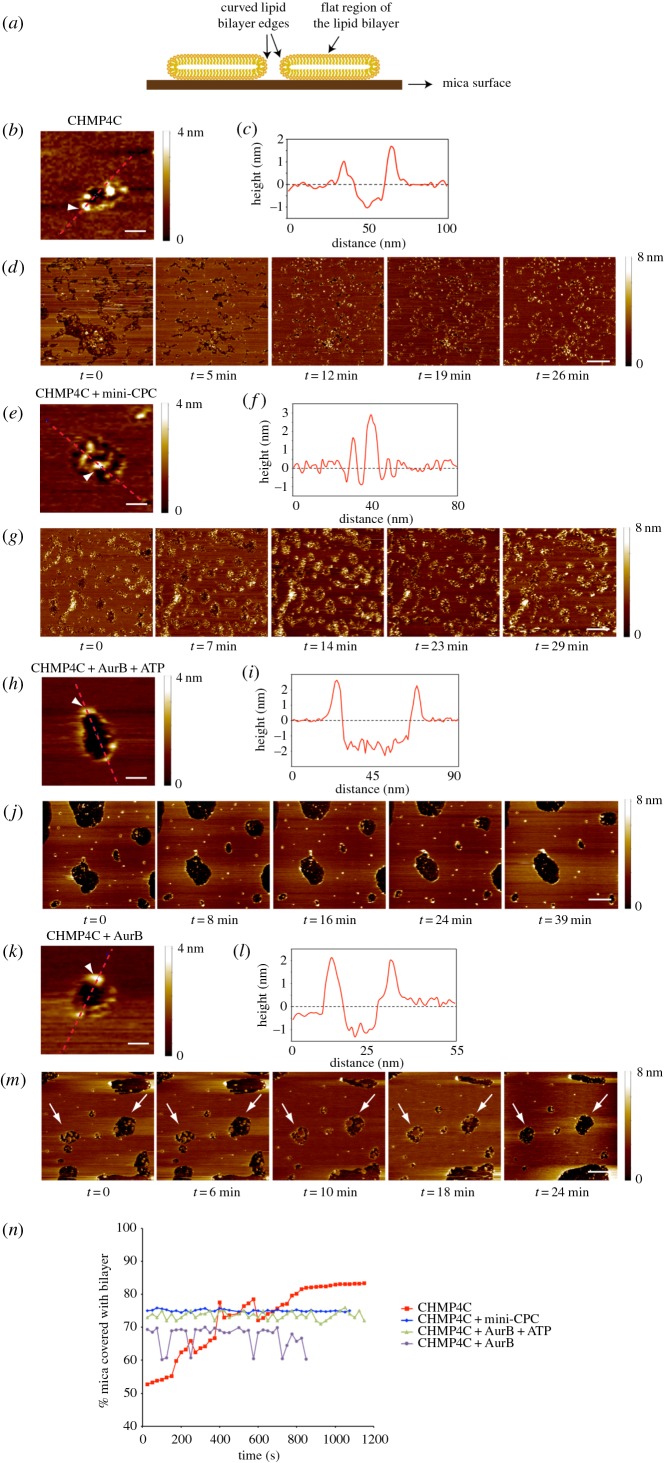
Figure 1.
The CPC affects the ability of CHMP4C to bind to and remodel membranes in vitro. (a) Schematic of a lipid bilayer (yellow) assembled on a mica surface (brown). The central portion of the bilayer is flat, whereas the edges of the bilayer are highly curved. (b) Zoomed AFM image of a lipid bilayer incubated with CHMP4C. A height bar is shown on the right. Scale bar, 20 nm. (c) Height relative to the mica surface is plotted along the dotted line shown in (b). The position of the arrowhead (at the bilayer edge) along the line is also shown in (b), which is raised above the height of the bilayer surface, indicating the presence of protein. (d) Sequential AFM images of the same lipid bilayer in the presence of CHMP4C. A height bar is shown on the right. Scale bar, 200 nm. (e) Zoomed AFM image of a lipid bilayer incubated with CHMP4C + mini-CPC. A height bar is shown on the right. Scale bar, 50 nm. (f) Height relative to the mica surface is plotted along the dotted line shown in (e). The position of the arrowhead (at the bilayer edge) along the line is also shown in (e), which shows no rise at the bilayer edge, indicating no protein interaction with the bilayer but rather a concentration of protein on the mica surface. (g) Sequential AFM images of the same lipid bilayer in the presence of CHMP4C + mini-CPC. A height bar is shown on the right. Scale bar, 200 nm. (h) Zoomed AFM image of a lipid bilayer incubated with CHMP4C + Aurora B + ATP. A height bar is shown on the right. Scale bar, 50 nm. (i) Height relative to the mica surface is plotted along the dotted line shown in (h). The position of the arrowhead (at the bilayer edge) along the line is also shown in (h), which is raised above the height of the bilayer surface, indicating the presence of protein. (j) Sequential AFM images of the same lipid bilayer in the presence of CHMP4C + Aurora B + ATP. A height bar is shown on the right. Scale bar, 200 nm. (k) Zoomed AFM image of a lipid bilayer incubated with CHMP4C and Aurora B. A height bar is shown on the right. Scale bar, 20 nm. (l) Height relative to the mica surface is plotted along the dotted line shown in (k). The position of the arrowhead (at the bilayer edge) along the line is also shown in (k), which is raised above the height of the bilayer surface, indicating the presence of protein. (m) Sequential AFM images of the same supported lipid bilayer in the presence of CHMP4C + Aurora B. A height bar is shown on the right. The arrows mark membrane gaps that started closing and then collapsed. Scale bar, 200 nm. (n) Variation in the percentage of the mica surface coated with lipid bilayer in the presence of various proteins.

