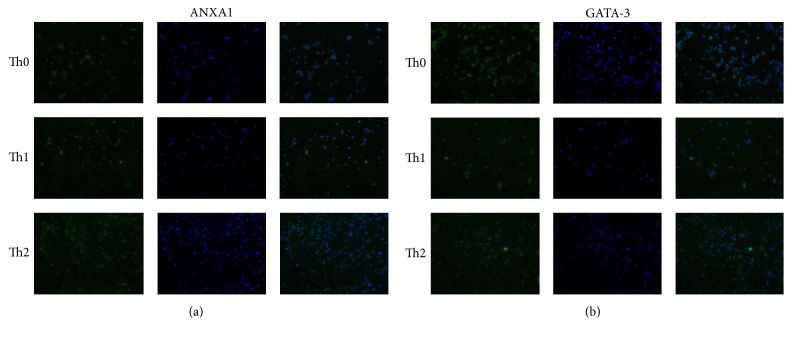
Figure 1.
ANXA1 and GATA-3 expression on Th0, Th1, and Th2 and localization on cytoplasm and membrane. (a) Immunofluorescence analysis of ANXA1 expression on Th0, Th1, and Th2. Immunofluorescence was carried out using green fluorescent tagged secondary anti-ANXA1. The cell nuclei were stained with DAPI. (b) Immunofluorescence analysis of GATA-3 expression on Th0, Th1, and Th2. Immunofluorescence was carried out using green fluorescent tagged secondary anti-GATA-3. The cell nuclei were stained with DAPI.

