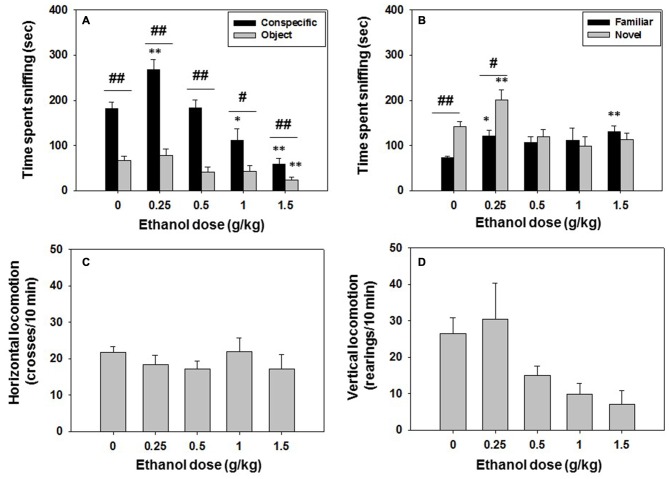
Figure 2.
Effect of ethanol in social preference and recognition tests. Data are expressed as mean (±SEM) of time spent sniffing (A) conspecific and object in the social preference test, (B) familiar and novel conspecifics in the social recognition test, and (C) horizontal and (D) vertical locomotion during the social preference test. *p < 0.05, **p < 0.01 significant differences from a vehicle for the same target. #p < 0.05, ##p < 0.01 significant differences between time spent sniffing both targets for the same dose of ethanol.

