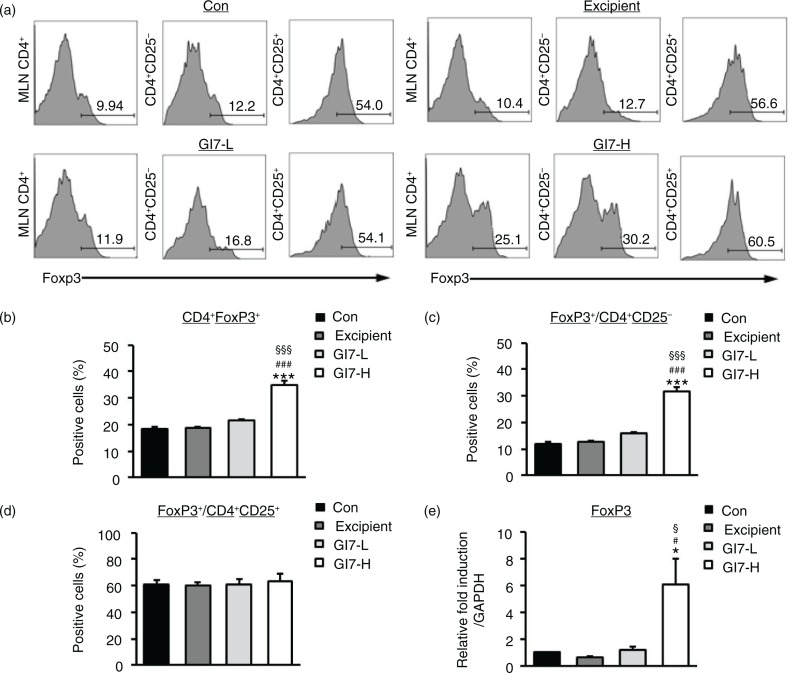
Fig. 6.
Expression of CD4+Foxp3+ T cells in MLNs of NC/Nga mice. (a) Foxp3 levels were examined by flow cytometry in MLN CD4+ T cells. Levels of Foxp3+ cells were analyzed in CD4+ (b), CD4+CD25- (c), and CD4+CD25+ (d) populations. Expression level of Foxp3 in lesional skin was analyzed by qPCR. Relative fold induction of the target gene is compared with that of the housekeeping gene GAPDH. (e). Results are expressed as the mean+SD (n=6). *p<0.05, ***p<0.001 versus the control group; # p<0.05 versus the excipient group; § p<0.05, §§§ p<0.001 versus the GI7-L group.

