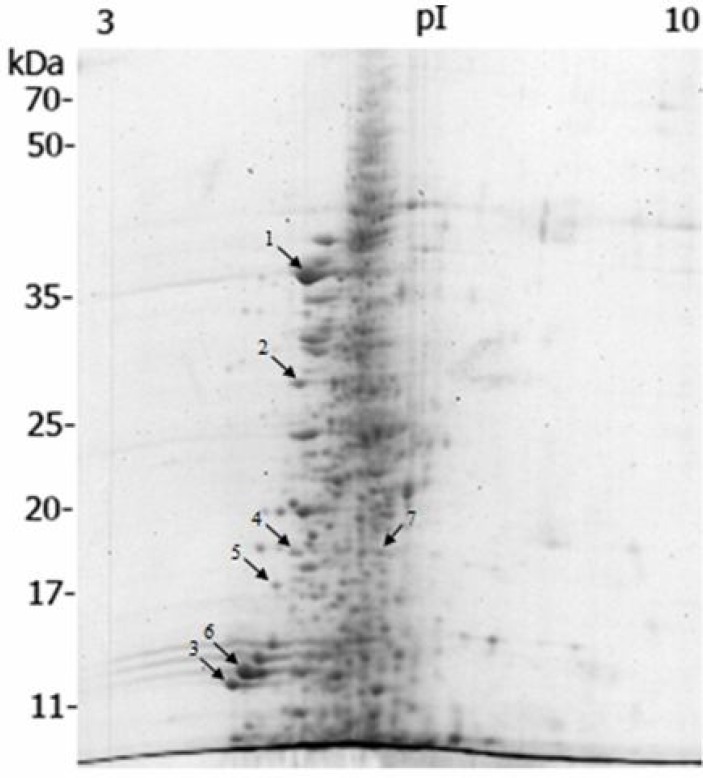
Fig. 1.
2-DE map of muscle proteins of rainbow trout (Oncorhynchus mykiss), prepared by linear wide-range immobilized pH gradients (pH = 3-10, 17 cm; BioRad, USA) in the first dimension and on 12% SDS-PAGE for the second dimension. Proteins were stained with colloidal coomassie brilliant blue G-250. Labeled spots indicate identified proteins with significant altered expression profile after dietary β-glucan treatment (see Table 2

