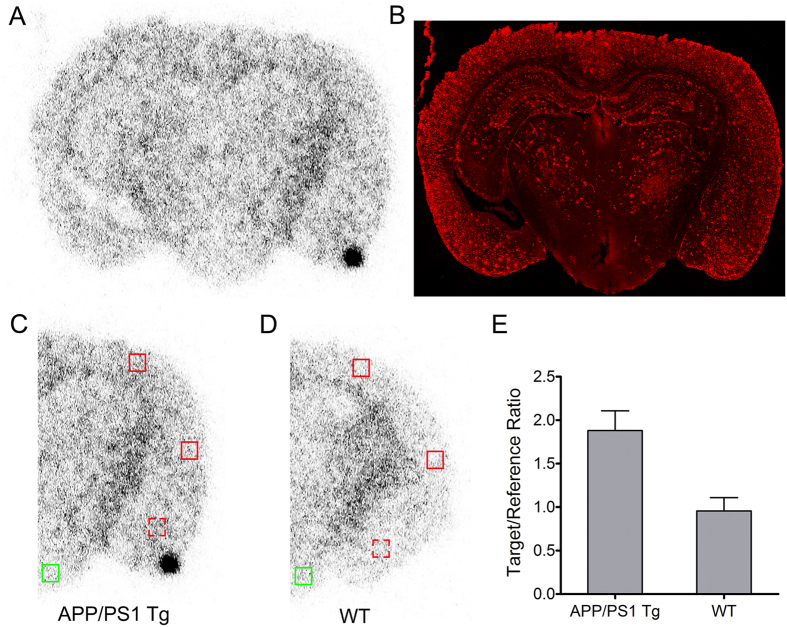
Figure 7. Ex vivo autoradiography images of 24-mo APP/PS1 Tg and WT control mouse after injection with [18F]-9.
(A) Coronal autoradiography image obtained at 30 min post-injection of [18F]-9 in the 24 months APP/PS1 Tg mouse. (B) Immunofluorescence staining of the same section with monoclonal anti-Aβ antibody to assess plaque density. (C,D) Count intensities were determined in three target ROIs (red boxes) for APP/PS1 Tg (C) and WT control (D), based on high Aβ plaque density in the immunostained APP/PS1 Tg section. Solid red boxes represent the locations of target ROIs in cortex, while dashed red boxes represent the locations of target ROIs in amygdala. Count intensities were also measured in a reference ROI (hypothalamus) with low plaque density, represented by green boxes. (E) Levels of tracer activity were analyzed by comparing the target/reference count intensity ratios for APP/PS1 Tg and WT control mice (mean + SD, n = 3).

