Figure 2.

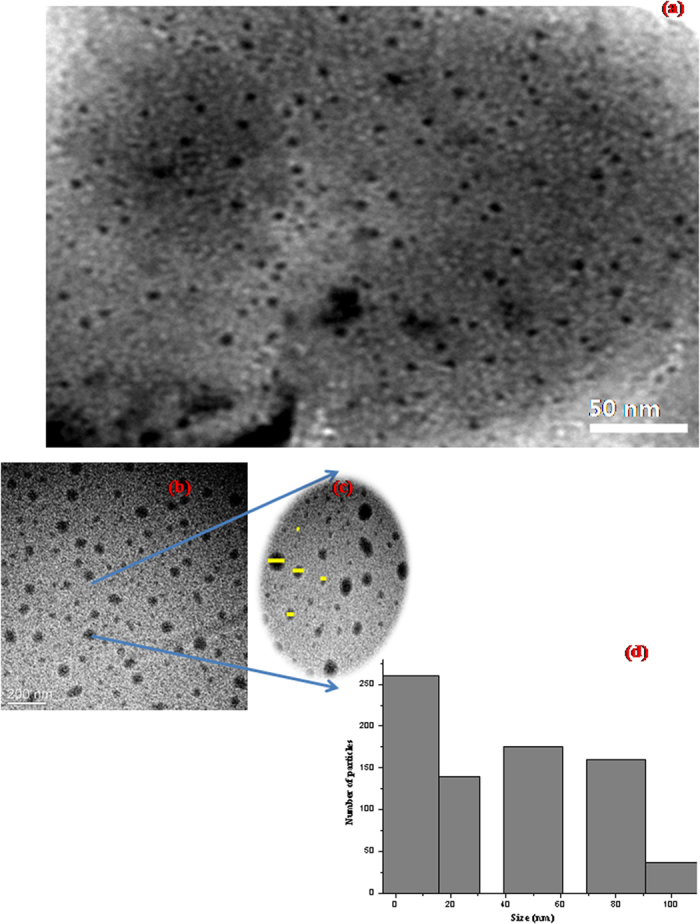
TEM image showing (a) predominating 5–10 nm sized particles (b) 20–25 nm, 50 nm, 80 nm and 100–300 nm particles, (c) the five different sized particles highlighted (d) Particle size distribution histogram.

TEM image showing (a) predominating 5–10 nm sized particles (b) 20–25 nm, 50 nm, 80 nm and 100–300 nm particles, (c) the five different sized particles highlighted (d) Particle size distribution histogram.