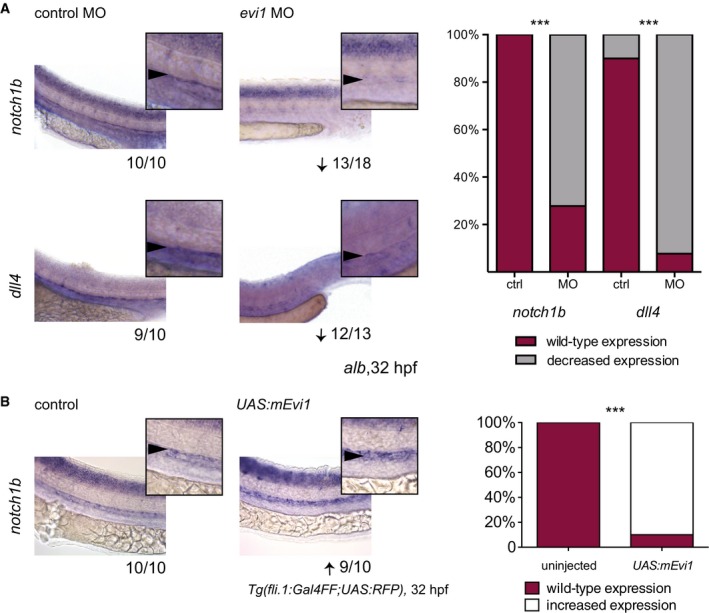
WISH of notch1b (upper) and dll4 (lower) in both control (left)‐ and evi1 MO‐injected embryos (right).
WISH of notch1b in uninjected (left) and UAS:mEvi1 plasmid DNA‐injected (right) Tg(fli.1:Gal4FF;UAS:RFP) embryos resulting in endothelial‐specific evi1 induction.
Data information: Lateral views are shown, with anterior to the left, dorsal up. Squares represent enlargements of the region of interest. Numbers indicate the amount of embryos with the respective phenotype/total number of embryos analyzed in each experiment. Arrows indicate up‐ or downregulation for each gene. A minimum of two biological replicates was performed for each marker with at least
n = 5 embryos per experiment. For each analyzed gene, quantitation of results is shown, displaying the percentages of embryos with normal vs. changed gene expression for each condition. A Fisher's exact test was applied to calculate statistical significance. n.s., not significant; ***
P < 0.001.

