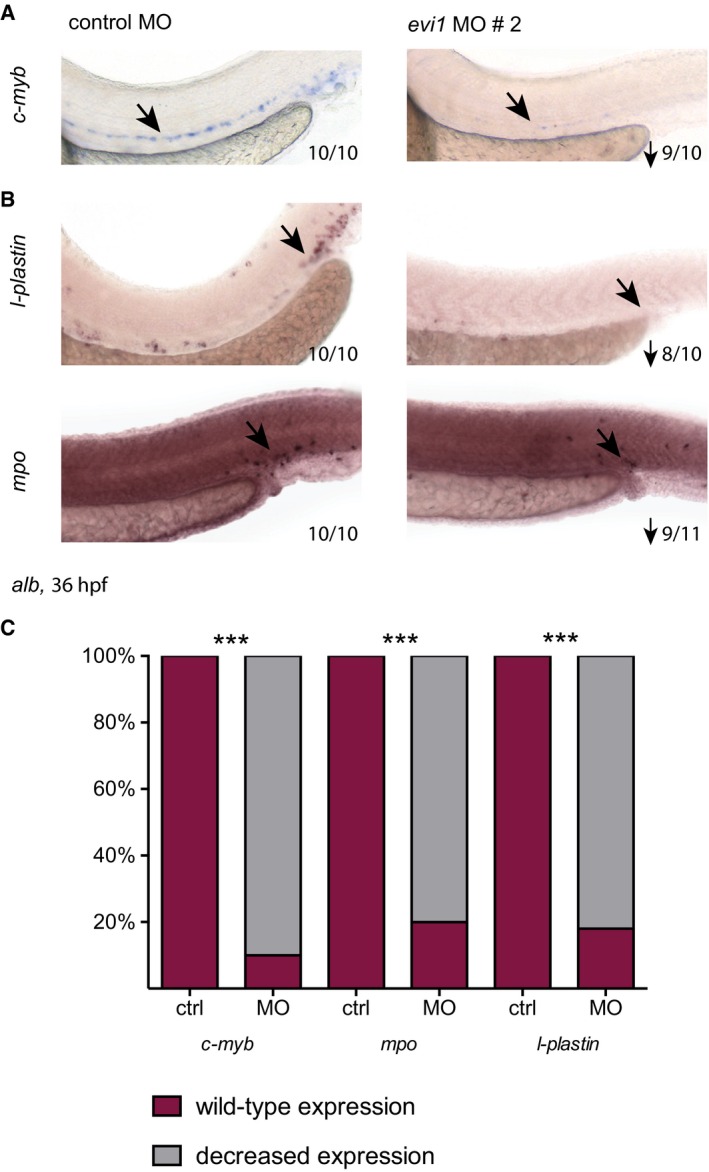
WISH of c‐myb in control‐ and evi1 MO2‐injected albino (alb) embryos.
WISH of l‐plastin (upper) and mpo (lower) in control‐ and evi1 MO2‐injected alb embryos.
For each analyzed gene, quantitation of results is shown, displaying the percentages of embryos with normal vs. decreased gene expression for each condition. A Fisher's exact test was applied to calculate statistical significance (***P < 0.001).
Data information: Gene expression is reduced upon
evi1 MO2 injection as indicated by the black arrows. Lateral views are shown, anterior to the left, dorsal up. Numbers indicate the amount of embryos with the respective phenotype/total number of embryos analyzed in each experiment. Arrows indicate up‐ or downregulation in each condition.

