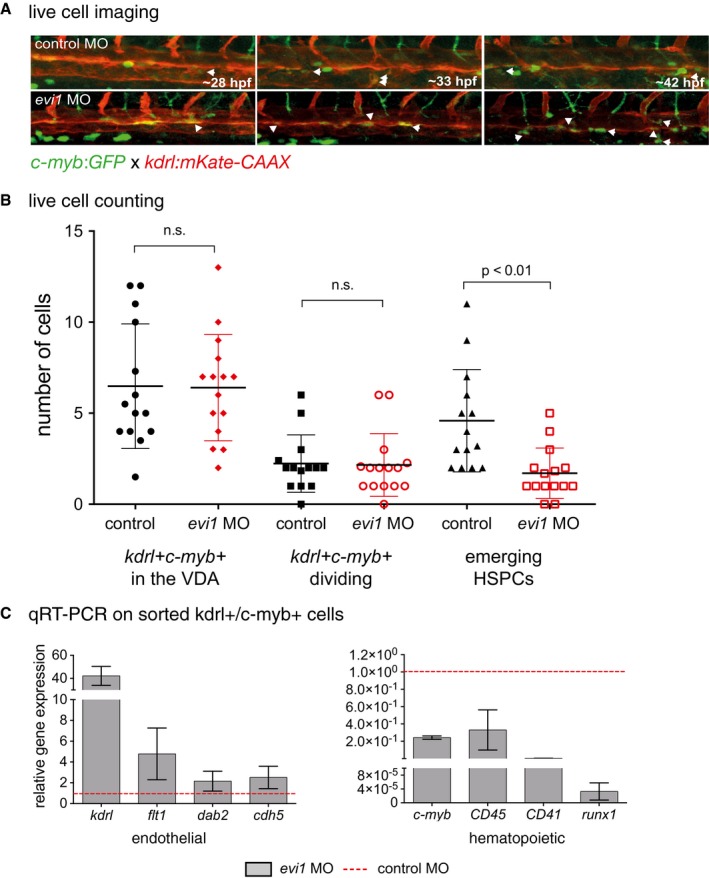
Figure 3. evi1 regulates HSC emergence from the VDA .

- Confocal time‐lapse live imaging was performed in Tg(c‐myb:GFP; kdrl:mKate‐CAAX) embryos from 28 to 42 hpf (Movie EV1). Shown are three representative time points in which the transformation from hemogenic endothelial cells to the hematopoietic fate is visible, indicated by the white arrowheads. For each time point, merged images are shown. White arrowheads denote double‐positive cells.
- Cell counts of total numbers of kdrl + cmyb1 + cells “in view”, dividing and, respectively, emerging HSPCs. n = 10 movies from n = 3 biological replicates were analyzed. A nonparametric Mann–Whitney U‐test was used to test for statistical significance, and error bars are shown as ± s.d.
- Gene expression analysis of endothelial (kdrl, flt1, dab2, cdh5) and blood‐specific genes (c‐myb, CD45, CD41, runx1) in sorted kdrl + c‐myb + cells from 34 hpf Tg(c‐myb:GFP; kdrl:mKate‐CAAX) embryos. Cells were isolated from 15 to 25 pooled embryos per sample. Three biological experiments were performed with one representative shown. Error bars indicate s.d. of three technical replicates for each representative experiment.
