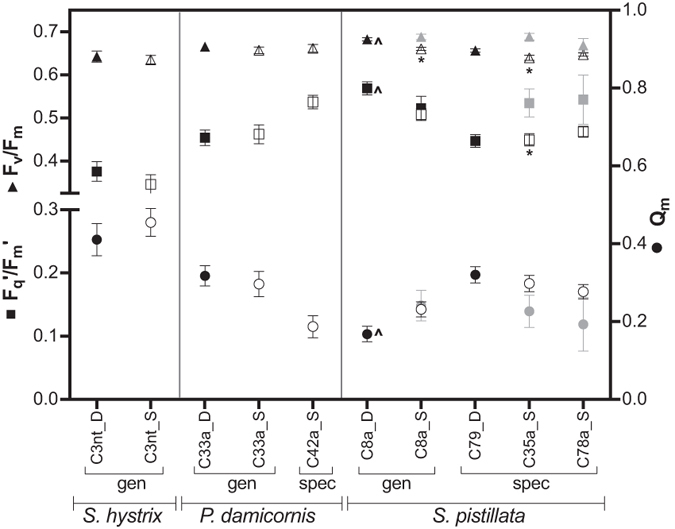
Figure 7.

Detailed photosynthetic performance measured in November 2005 only: mean effective quantum yield (Fq′/Fm′; squares, left y-axis), dark-adapted yield (Fv/Fm; triangles, left y-axis) and pressure over photosystem II (Qm; circles, right y-axis). Depth is indicated with ‘D’ (deep, black symbols) or ‘S’ (shallow, grey symbols), where filled symbols represent controls and open symbols represent transplanted samples (i.e. shallow controls are grey filled, and shallow to deep transplants are black open circles). Significant differences at p ≤ 0.01 between control and transplants are indicated with ‘*’ and between depth controls (DD and SS) within a symbiont with ‘^’.
