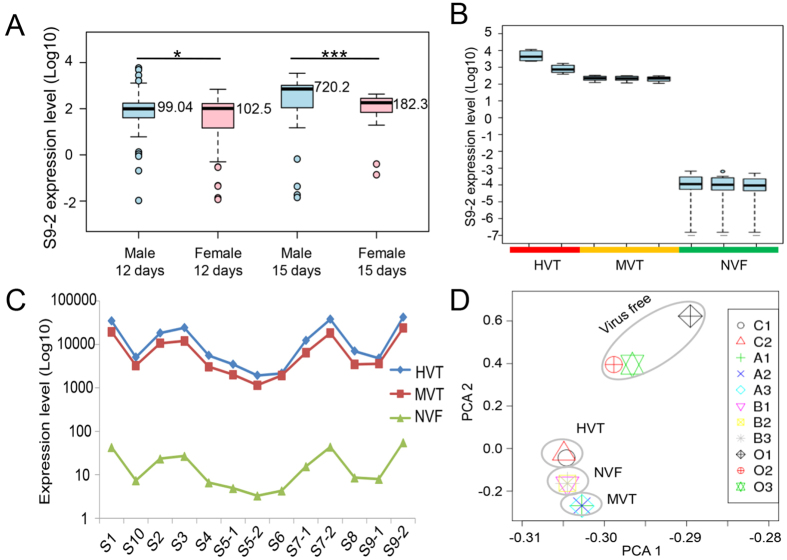
Figure 2. The expression levels of SRBSDV S9 segment in groups with different viral titers and a principal component analysis (PCA) of gene expression.
(A) The expression level of SRBSDV S9 in male and female individuals on the 12th and 15th day, respectively. (B) The expression level of SRBSDV S9 for groups of males with three different viral titers on the 12th day. (C) Viral gene expression patterns. The expression of all SRBSDV genes was graphed; lines correspond to each group. (D) Principal component analysis (PCA) across libraries based on gene expression. The first two components in the principal component analysis are shown, and the distance between the groups indicates the variance. *p < 0.05, ***p < 0.001.

