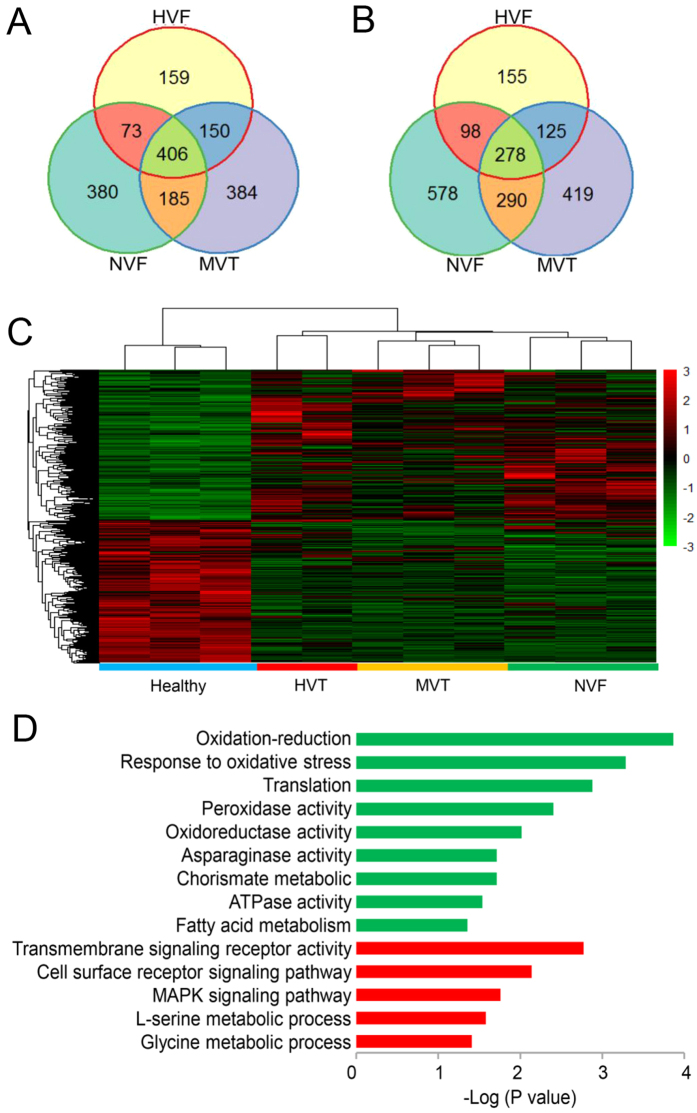
Figure 3. Differentially expressed genes (DEGs) and a GO enrichment analysis.
(A) Venn diagram showing the number of genes commonly and differentially expressed in the HVT, MVT, and NVF groups for upregulated (A) and downregulated genes. (B,C) Global expression patterns of 3,676 DEGs using a hierarchical clustering analysis. (D) GO enrichment analysis of co-regulated DEGs. The different colors represent different DEGs (down-regulated genes are marked green and up-regulated genes are marked red).

