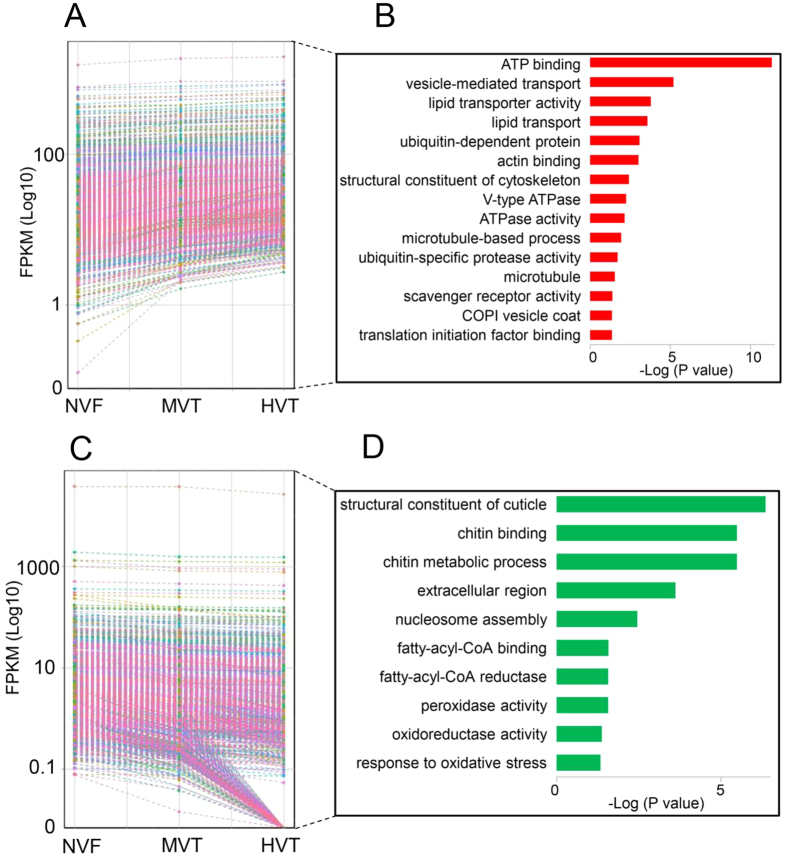
Figure 4. Gene expression patterns of MIEGs and MDEGs and a GO enrichment analysis.
(A) The expression of each gene was plotted against the viral titer from NVF to HVT. (B) GO enrichment analysis of MIEGs. (C) The expression of each gene was plotted against the viral titer from NVF to HVT. (D) GO enrichment analysis of MDEGs.

