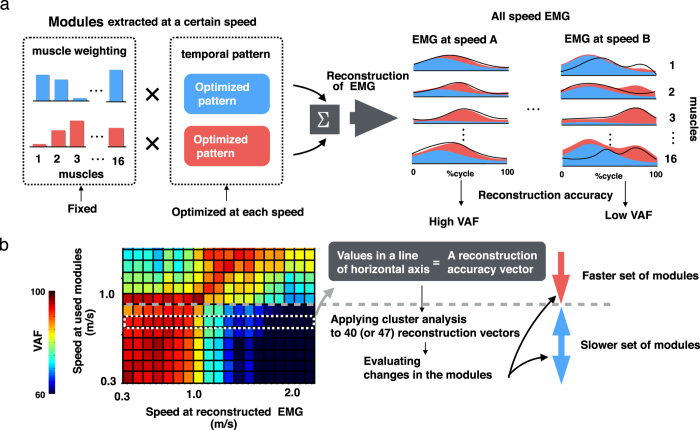
Figure 2.
Schematic of the EMG reconstruction method (a) and the evaluation of shifts in components of modules based on reconstruction accuracy vectors (b). (a) EMG reconstruction was accomplished by fixing muscle weighting components (blue and red bars in the left panels) while optimizing the temporal pattern components (blue and red rectangles in the left panels) to reduce the error between the original EMG (black waveforms in the right panels) and reconstructed EMG (areas filled with blue or red in the right panels). Then, variance accounted for (VAF) was calculated between the original and reconstructed EMG. If the components are able to reconstruct the EMG signal with high accuracy, the VAF represents high value (at speed A, left waveforms and filled area). Otherwise, the VAF represents low value (at speed B, waveforms and filled area). This procedure was performed for one set of components at all speeds. That is, a 40- (or 47-) dimensional reconstruction accuracy vector was created for 40 (or 47) speeds. (b) The reconstruction matrices (heat maps) were created from the reconstruction accuracy vectors across all speeds. Values in a line along the horizontal axis (surrounded by a white dotted line) represent a reconstruction accuracy vector. The shifts of components of modules (at 0.9 m/s in this example; a grey dashed crossbar between two arrows) were assessed by cluster analysis applied to the overall speeds of reconstruction vectors.

