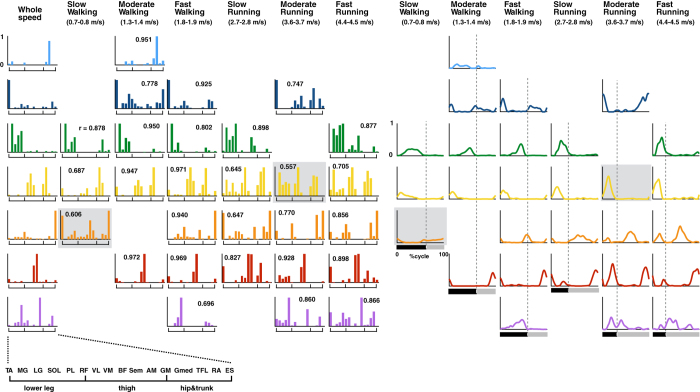
Figure 5. Extracted muscle weighting components and corresponding temporal patterns in whole speed and each representative speed in a representative participant.
Each bar height represents the relative level of activation of each muscle within the muscle weighting components. Correlation coefficients between modules for the whole speed and for the representative speed in the same row are shown. The same types of components are represented by the same colour (r > 0.623, p < 0.01). Modules indicated with grey backgrounds have r > 0.497 (p < 0.05), but <0.623. An enlarged view of the x-axes is shown in the bottom left corner. Temporal pattern components (waveforms) are placed in the corresponding position to their muscle weighting components. The speed for the representative participant is shown below the condition names. The underbars denote stance phase (black) and swing phase (grey) in a gait cycle. The dotted lines denote the transition timing from stance phase to swing phase.

