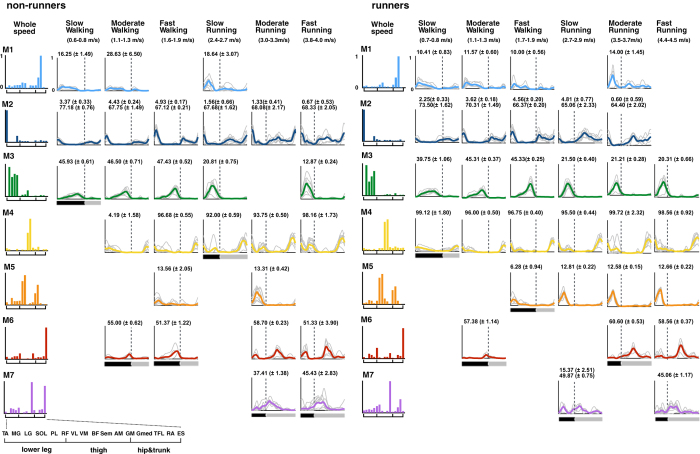
Figure 6. Seven types of muscle weighting components from whole-speed datasets in all participants per group, and shifts in the active components depending on speed and mode and their corresponding temporal pattern components.
The averages of each cluster of muscle weighting components from whole-speed datasets are shown in the left column (M1–M7). An enlarged view of the x-axes of these components is shown in the bottom left corner. If the components are used in the representative speeds (see Table 1), corresponding temporal pattern components are shown to the right of these components. The peak timings (% cycle) are shown just above each temporal component. Ranges of speed of each representative speed for all participants are shown below the condition names. The underbars denote average stance phase (black) and swing phase (grey) in a gait cycle across subjects. The dotted lines indicate the average transition timing of stance phase to swing phase across subjects.

