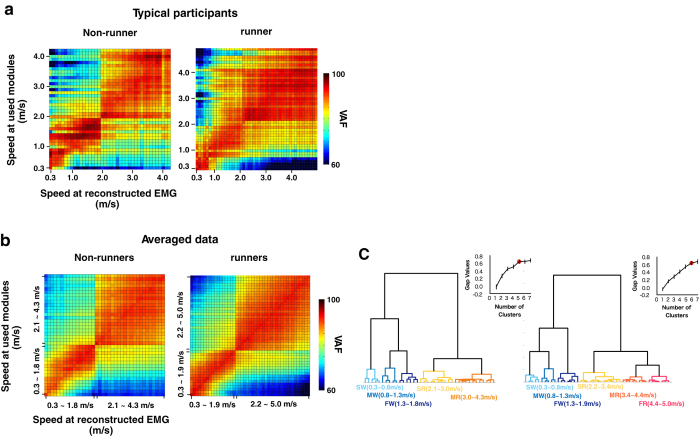
Figure 7.
Reconstruction accuracy matrices for representative participants (a), averaged data for each participant group (b), and results of cluster analysis applied to the averaged data (c). (a,b) VAF values in a line along the horizontal axis represent a reconstruction accuracy vector for a particular speed. Changes of the values of the vector indicate changes in the components of modules. A colour scale denotes the VAF value. The data in the walk-run transition speed range were excluded when averaging data. (c) Dendrograms represent the results of cluster analysis (Ward’s method, Euclidian distance) applied to the averaged data. The line charts show the optimal cluster number based on the gap statistic values. Error bars indicate the SE. The red circles indicate the optimal cluster number. The same clusters are indicated with the same colour. SW: slow walking; MW: moderate walking; FW: fast walking; SR: slow running; MR: moderate running; FR: fast running.

