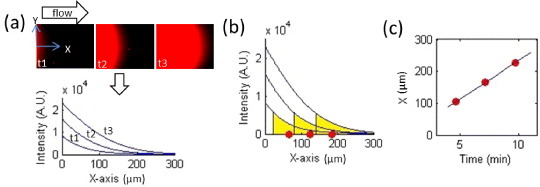
Figure 6.

Illustration of how we obtained the membrane species’ concentration front velocity. (a) The y-direction averaged fluorescence intensity was plotted along the x-axis. (b) The leading edge area of the intensity profiles at different time points were defined and their center of mass positions were determined. (c) The front velocity was obtained by tracking how the leading edge position changes with time.
