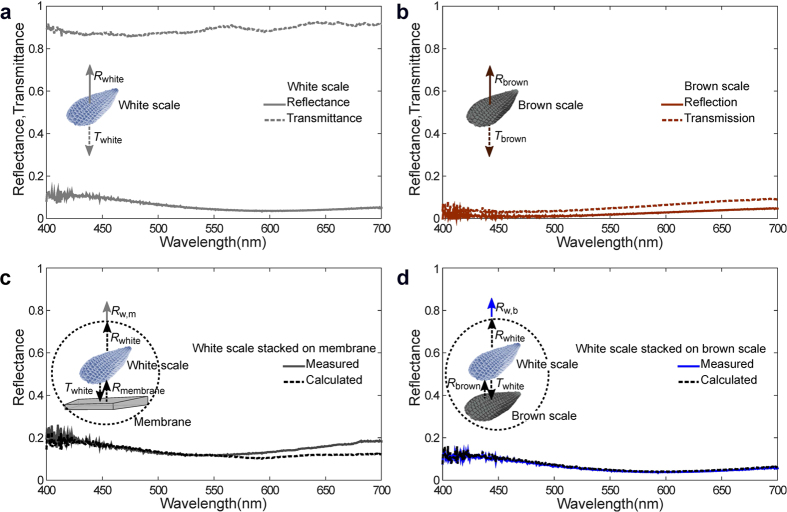
Figure 4. Single scale spectroscopy of Hypolimnas salmacis.
(a) Spectra of a single white scale in reflection (solid line) and transmission (dashed line). (b) Spectra of a single brown scale in reflection (solid line) and transmission (dashed line). (c) Reflection spectrum measured on stack of a white scale on a wing membrane (solid line). Individually measured reflectance and transmittance properties are used to calculate the white scale-wing membrane stack reflection (dashed line) and compared with the experimental stack measurement (solid line). A schematics of a single white scale spectrometry on a wing membrane with individual reflectance and transmittance terms is provided in the inset. (d) Reflection spectrum measured on stack of a white and brown scale (solid line) which demonstrates the blue colouration due to the peak at the 420 nm. Individually measured reflectance and transmittance properties are also used to calculate (dashed line) and confirm the experimental stack measurement (solid line). The insets show a schematic of the measurement.

