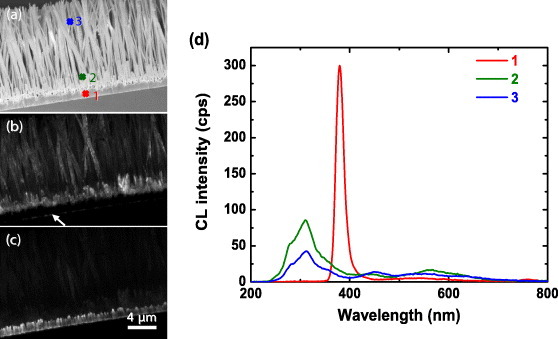
Figure 4.

SEM images of Zn2SiO4 nanotubes (a) and the corresponding CL images of 310 nm (b) and 380 nm (c) emission generated at 5 kV and 1.0 nA. Panel (d) presents CL spectra taken at 5 kV and 1.0 nA from the buffer layer and the nanotubes at locations indicated in (a).
