
Figure 9.
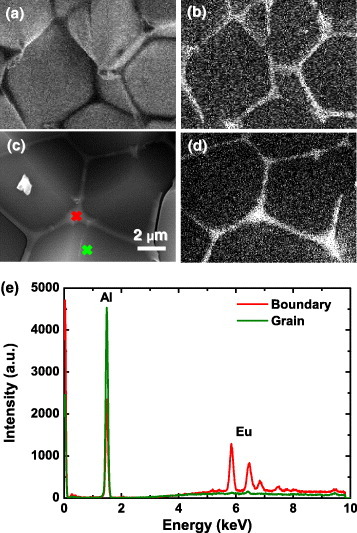
CL images of 360 nm (a) and 550 nm (b) emission of AlN:Eu. SEM image (c) and EDS image (d) of Eu distribution. Panel (e) shows EDS spectra taken from the grain and the grain boundary, as indicated in (c).
Official websites use .gov
A
.gov website belongs to an official
government organization in the United States.
Secure .gov websites use HTTPS
A lock (
) or https:// means you've safely
connected to the .gov website. Share sensitive
information only on official, secure websites.
CL images of 360 nm (a) and 550 nm (b) emission of AlN:Eu. SEM image (c) and EDS image (d) of Eu distribution. Panel (e) shows EDS spectra taken from the grain and the grain boundary, as indicated in (c).