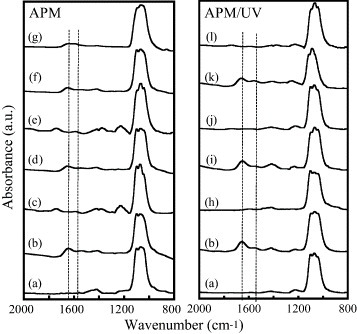
Figure 5.

FTIR spectra of the (a) as-prepared HAp sensor; (b) fibrinogen adlayer on the as-prepared HAp sensor; HAp sensors with adsorbed fibrinogen after one to five cycles of (b–g) APM and (h–m) APM/UV treatments. Curves (c, e, g, h, j and l) correspond to the treated HAp sensor, and curves (d, f, i and k) to the fibrinogen adlayer on the reused HAp sensor.
