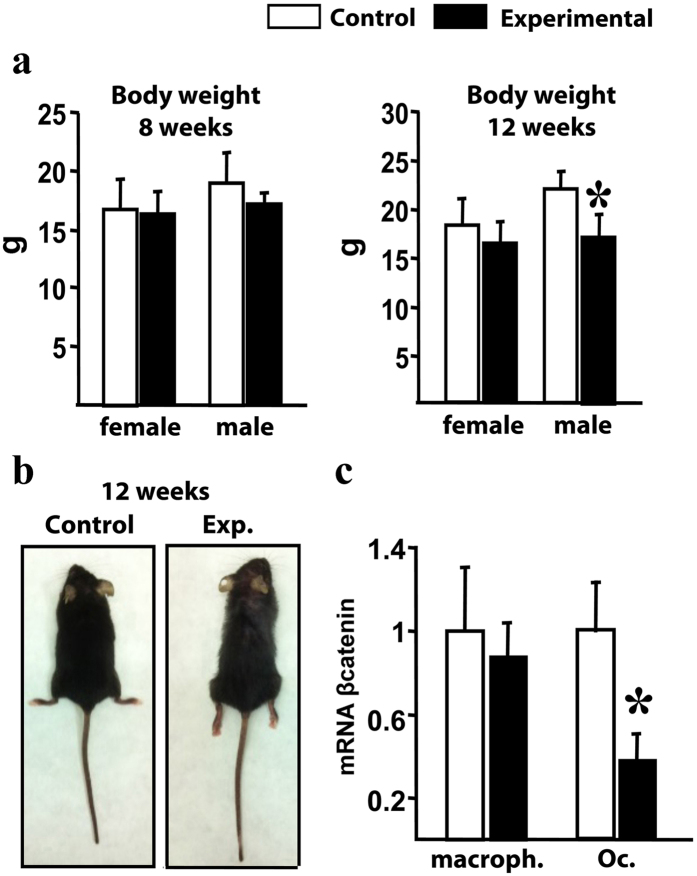
Figure 1. External appearance of Ctnnb1f/f;CtsKCre mice and βcatenin expression in macrophages and osteoclasts.
(a) Comparison of body weight between control and experimental littermate mice at 8 and 12 weeks of postnatal life (g, grams). (b) External body appearance of 12-week-old control and experimental mice. (c) RT-PCR quantification of βcatenin transcripts in macrophages and osteoclasts developed from non-adherent bone marrow cells cultured in the presence of M-CSF for 4 days, and M-CSF plus RANKL for 5 days, respectively (n = 4). Bars, Mean ± SD; *P < 0.05.

