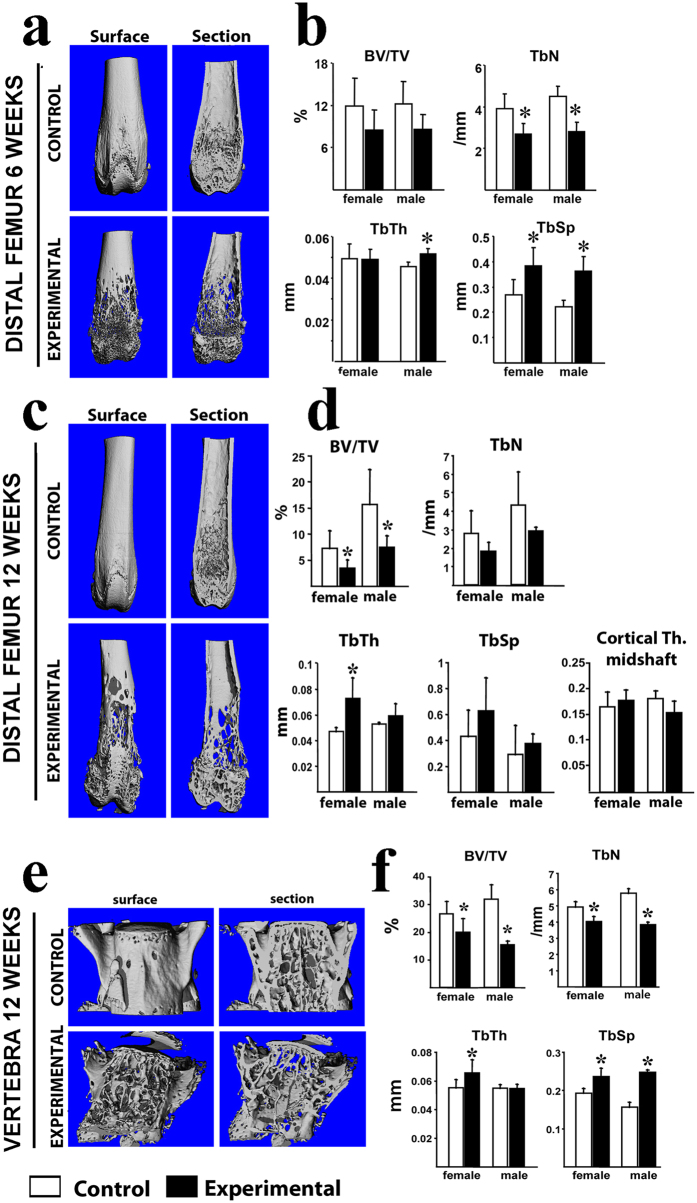
Figure 3. Micro–computed tomography analysis of Ctnnb1f/f;CtsKCre mice showing a severe loss of bone mass.
(a) Representative μCT images of the distal femur of the surface and mid-section of 6-week-old control and experimental littermates. (b) Histomorphometric quantification showing changes in trabecular number, trabecular space and trabecular thickness. (c) Representative μCT images of the distal femur of the surface and mid-section of 12-week-old control and experimental littermates. (d) Histomorphometric quantification showing changes in bone volume, and trabecular thickness. BV/TV: bone volume fraction; Tb.N: trabecular number; Tb.Th: trabecular thickness; Tb.Sp: trabecular separation. Ct.Th: average cortical thickness. (e) Representative μCT images of L5 vertebra of 12-week-old control and experimental littermates. (f) Histomorphometric quantification showing changes in experimental mice in all bone parameters analyzed. Surface and mid-sections are shown (indicated on the top). BV/TV: bone volume fraction; TbN: trabecular number; TbTh: trabecular thickness; TbSp: trabecular separation. CtTh: average cortical thickness. Bars, Mean ± SD; *P < 0.05

