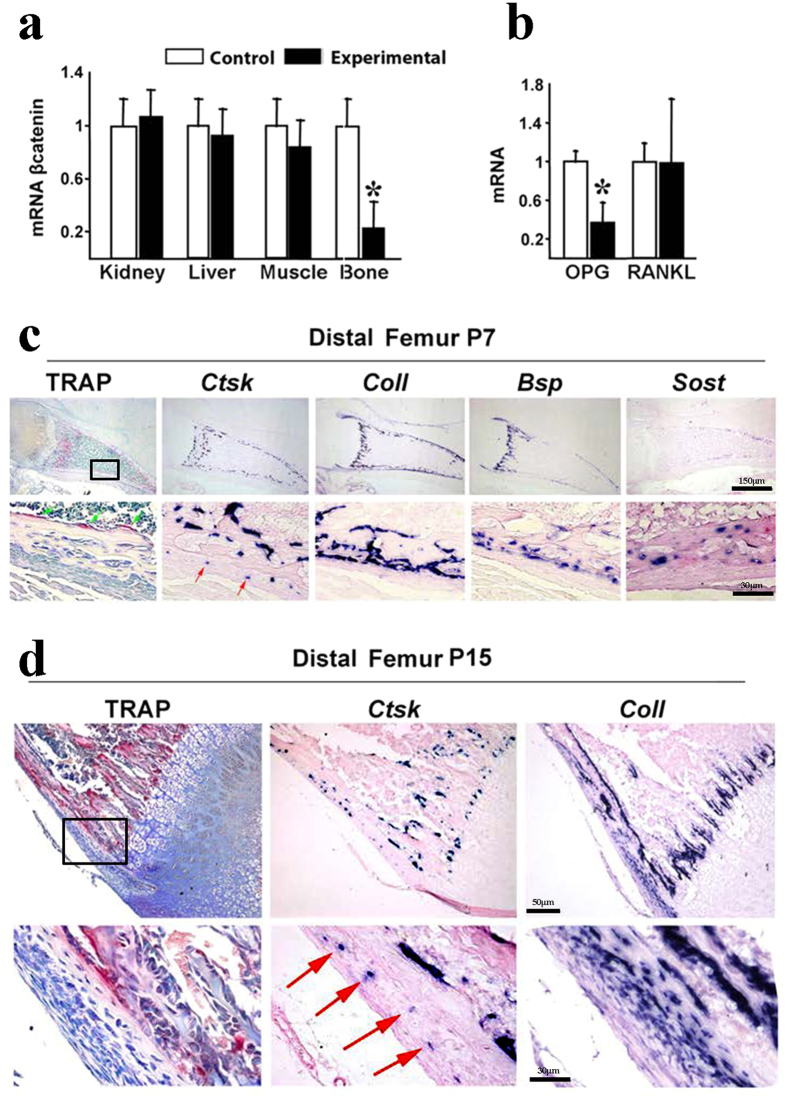
Figure 7. Reduced βcatenin and Opg mRNA expression in experimental bone tissue and pattern of CtsK expression in bone.
(a) Quantitative RT-PCR analysis of βcatenin mRNA from a battery of tissues harvested from 4-week-old mice (n = 3) showing specific but disproportionate reduction in bone. (b) Quantitative RT-PCR of Opg and Rankl mRNA in tibia of control mice and their experimental littermates (n = 4). (c) TRAP and in situ hybridization for CtsK, Col1, Bsp and Sost in consecutive sections of the distal femur of a P7 wild type animal. The marked square in the top row (bar: 150 μm) is amplified in the bottom row (bar: 30 μm). Note the presence of CtsK expressing cells (red arrows) in the inner layer of the periosteum that however are negative for TRAP staining and other osteoblastic markers. (d) TRAP and in situ hybridization for CtsK and Col1 in consecutive sections of the distal femur of a P15 wild type animal. The marked square in the top row (bar: 50 μm) is amplified in the bottom row (bar: 30 μm). At this stage the CtsK positive cells of the cambium layer also express Col1. Bars, Mean ± SD; *P < 0.05.

