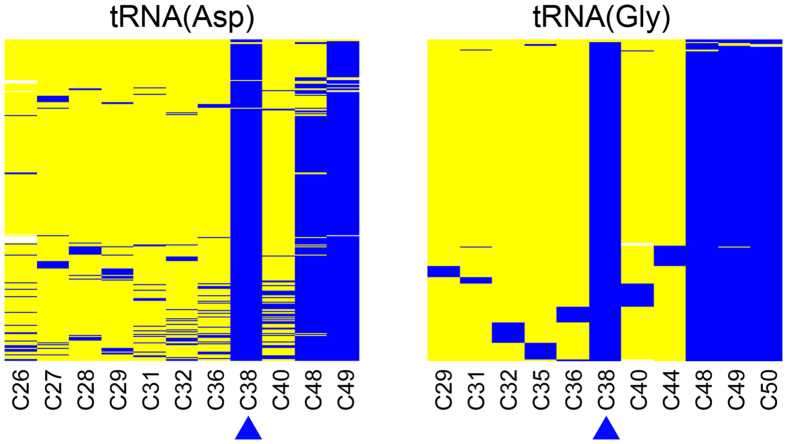
Figure 5. Methylation analysis of tRNA(Asp) and tRNA(Gly) by deep RNA bisulfite sequencing.
Each row represents a sequence read, each column a cytosine residue. Yellow boxes represent unmethylated cytosine residues, blue boxes indicate methylated cytosine residues, sequencing gaps are shown in white. The positional number of each specific cytosine residue is shown at the bottom and the Dnmt2 target site (C38) is highlighted by a blue arrowhead. Sequencing coverages were 713× for tRNA(Asp) and 462× for tRNA(Gly).

