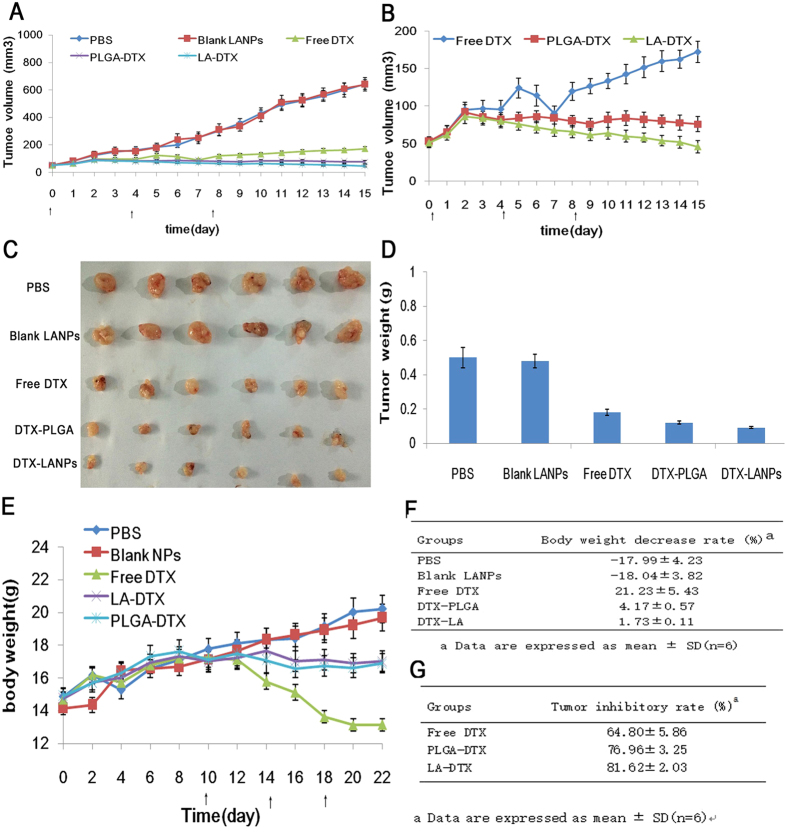
Figure 12. The anti-tumor efficiency in vivo in different treatment groups in A549 bearing nude mice.
The change of tumor volume indicated tumor growth curves (A). The enlarged exhibition of tumor growth in free DTX, DTX-LANPs and DTX-PLGANPs treatment groups (B). The images of excised tumors (C). The tumor weighed at the end of test (D). The change of body weight of A549 bearing nude mice after treatment (E). The decrease rate of body weight was measured at the end of the test, “-” indicating body weight increase (F). The tumor inhibitory rate measured with excised tumor weight.

