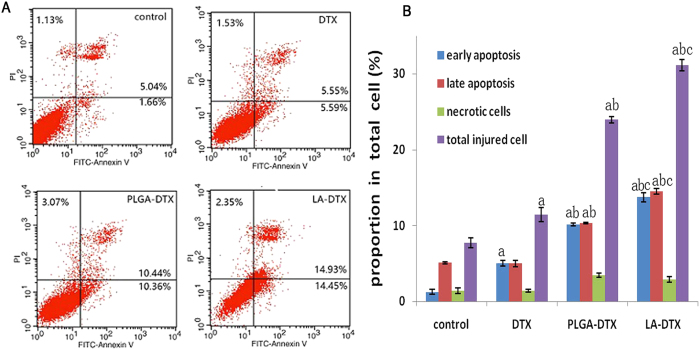
Figure 9. Cell apoptosis of A549 cells treated with free DTX, DTX-LANPs and DTX-PLGANPs at a DTX concentration of 10 ng/ml for 48 h.
Flow cytometry data of different treatment groups (A). Quantitative analysis of cells apoptosis (B). a, p < 0.0 vs. control; b, p < 0.01 vs. DTX; c, p < 0.05 vs. DTX-PLGANPs (n = 3).

