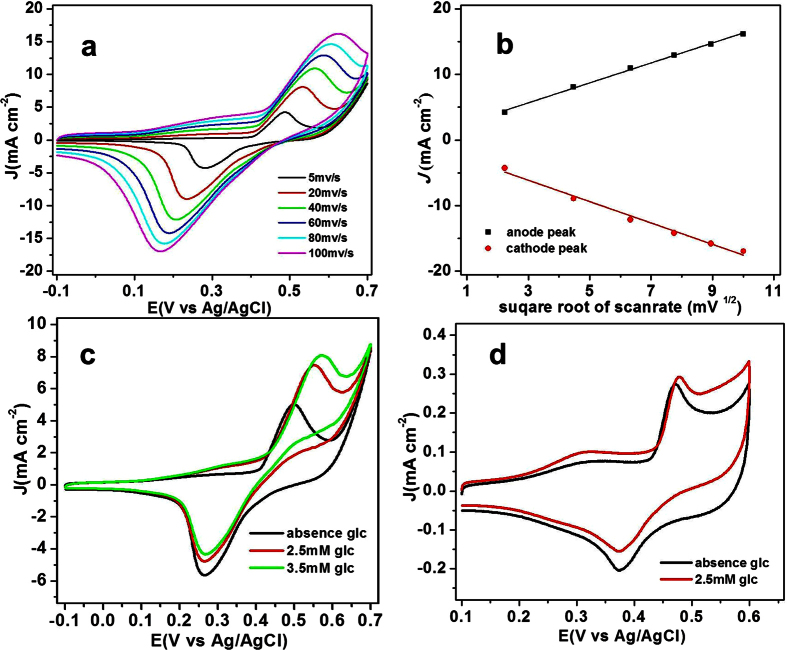
Figure 3.
(a) CVs of the NiO/GNS in 0.1 M NaOH at different scan rates (5–100 mV s−1). (b) Relationship between J and v1/2 for CVs of the NiO/GNS in 0.1 M NaOH. (c) CVs of the NiO/GNS in 0.1 M NaOH in the absence and presence of glucose at a scan rate 10 mVs−1. (d) CVs of the NiO in 0.1 M NaOH in the absence of glucose and the presence of glucose at a scan rate of 10 mVs−1.

