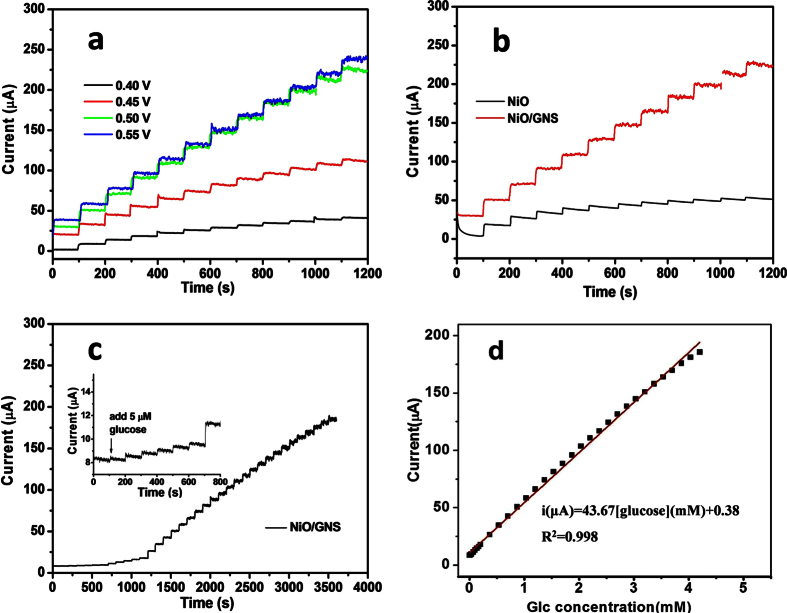
Figure 4.
(a) Amperometric response of the NiO/GNS with successive addition of 0.5 mM glucose into 0.1 M NaOH solution at different potentials. (b) Amperometric response of the NiO and the NiO/GNS with the successive addition of 0.5 mM glucose at 0.50 V. (c) Amperometric response of the NiO/GNS to successive addition of glucose at 0.5 V; inset: amperometric response to 5.0 μM glucose. (d) The corresponding calibration curve at the NiO/GNS eletrode.

