
. 2013 Oct 18;14(5):054402. doi: 10.1088/1468-6996/14/5/054402
 Content from this work may be used under the terms of the
 Figure 2.
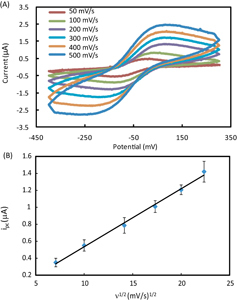
Electrochemical characterization of the paper-based biosensor array. (A) Typical cyclic voltammograms of 10 mM K3[Fe(CN)6] in 1 M KCl solution in an electrochemical biosensing module of the array device at various scan rates. (B) A plot of the cathodic peak current ipc versus the square root of the scan rate ν1/2, measured from the cyclic voltammograms (n = 5).