
. 2013 Oct 18;14(5):054402. doi: 10.1088/1468-6996/14/5/054402
 Content from this work may be used under the terms of the
 Figure 4.
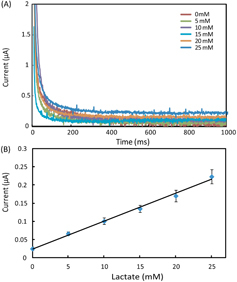
(A) Chronoamperometric curves and (B) the calibration plot for measurement of lactate in AU. The solid line in (B) represents a linear fit to experimental data with regression equation: y = 0.0076x + 0.025 (R2 = 0.995, n = 5).