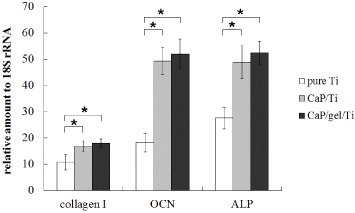
Figure 5.

Gene expressions of collagen I, ALP and OCN of MSCs on pure Ti, CaP/Ti and CaP/gel/Ti plates after culturing for 14 days. ∗: P < 0.05.

Gene expressions of collagen I, ALP and OCN of MSCs on pure Ti, CaP/Ti and CaP/gel/Ti plates after culturing for 14 days. ∗: P < 0.05.