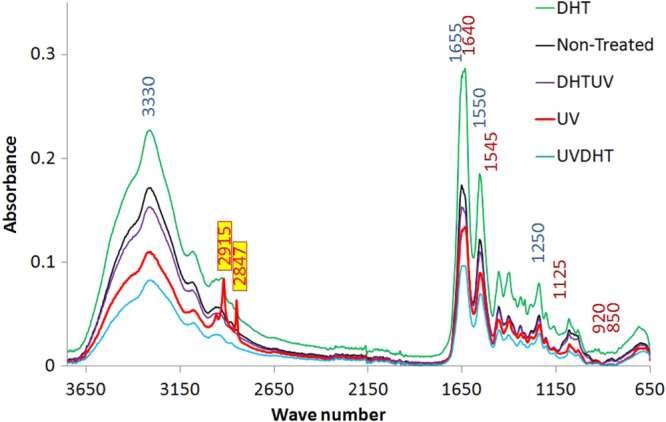
Figure 11.

Typical FTIR absorption spectra of 15% CDM material with different treatments. Wave numbers defined in blue and dark red are representative for collagen and proteoglycans respectively. The two sharp peaks at 2847 and 2915 on 15% UV are representative for alkane groups formed during UV treatment.

 Content from this work may be used under the terms of the