
Figure 3.
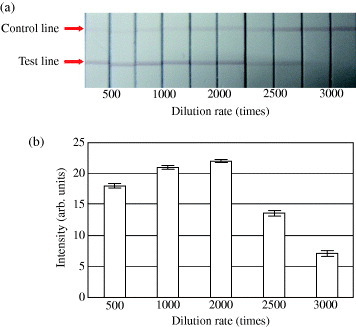
Effect of dilution rate on color intensity. Results obtained from an immunochromatographic test strip treated with diluted saliva (a). Intensity for diluted dog sIgA under different dilutions (b). Error bars indicate the standard deviations (n= 3).