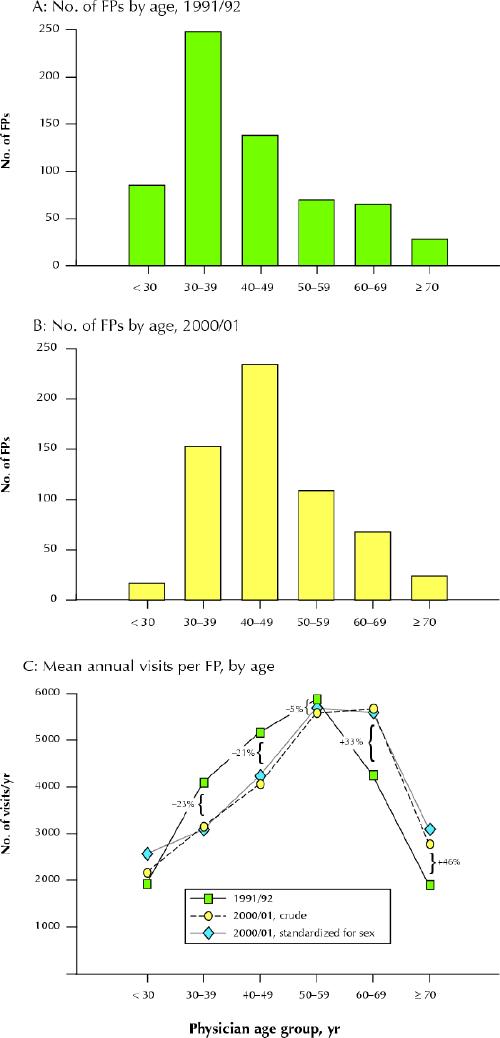
Fig. 1: Number of Winnipeg family physicians (FPs) by 10-year age group in 1991/92 (A) and 2000/01 (B), and mean annual number of visits provided per FPs by physician age, 1991/92 and 2000/01 (C). Fig. 1C also presents the percent change in number of visits for each physician age group from 1991/92 to 2000/01 (these calculations are based on the crude data for 2000/01). Photo: Chesley Sheppard
