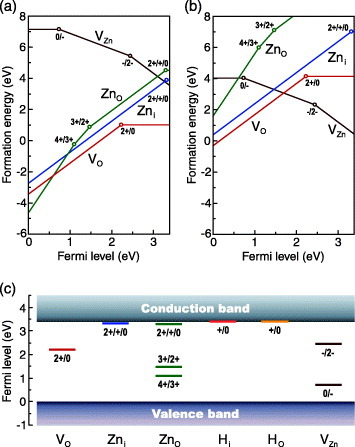
Figure 5.

Formation energies and thermodynamic transition levels of the O vacancy (VO), the Zn interstitial at the octahedral site (Zni), the Zn anti-site (ZnO) and the Zn vacancy (VZn) in ZnO, obtained using the HSE (a=0.375) hybrid functional in conjunction with finite cell-size corrections [44, 81]. Formation energies as a function of the Fermi level at the (a) O-poor (Zn-rich) limit and (b) O-rich (Zn-poor) limit. The slope corresponds to the charge state. Only these charge states that are energetically the most favorable at a given Fermi level are shown for each defect. Thermodynamic transition levels are indicated by open circles. For Zni and ZnO, the ε(2+/+) and ε(+/0) levels are very close to each other and are shown as ε(2+/+/0) levels. (c) Thermodynamic transition levels, corresponding to open circles in panels (a) and (b). Also shown are levels of H impurities at the interstitial site (Hi), i.e. OH−-like configuration and the O site (HO).
