Figure 4.

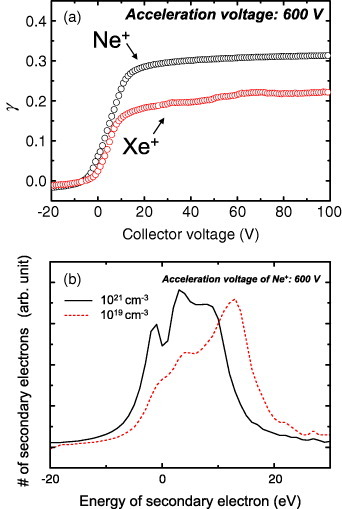
(a) γ versus collector voltage for the sample with an electron density of N=1021 cm−3. (b) Energy distribution of the emitted electrons for Ne+ excitation of samples with electron densities of 1019 and 1021 cm−3.

(a) γ versus collector voltage for the sample with an electron density of N=1021 cm−3. (b) Energy distribution of the emitted electrons for Ne+ excitation of samples with electron densities of 1019 and 1021 cm−3.