Figure 7.

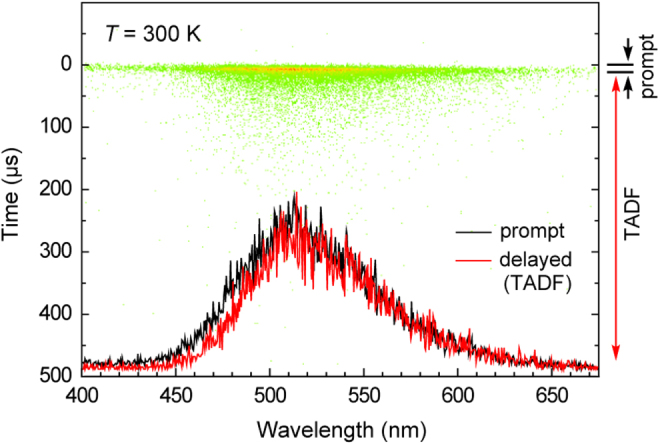
Streak image and PL spectra of a 6 wt%-ATP–PXZ:CBP film taken at 300 K showing the prompt (fluorescence, black) and delayed (TADF, red) components. Each dot in the streak image corresponds to the photon count of PL.

Streak image and PL spectra of a 6 wt%-ATP–PXZ:CBP film taken at 300 K showing the prompt (fluorescence, black) and delayed (TADF, red) components. Each dot in the streak image corresponds to the photon count of PL.