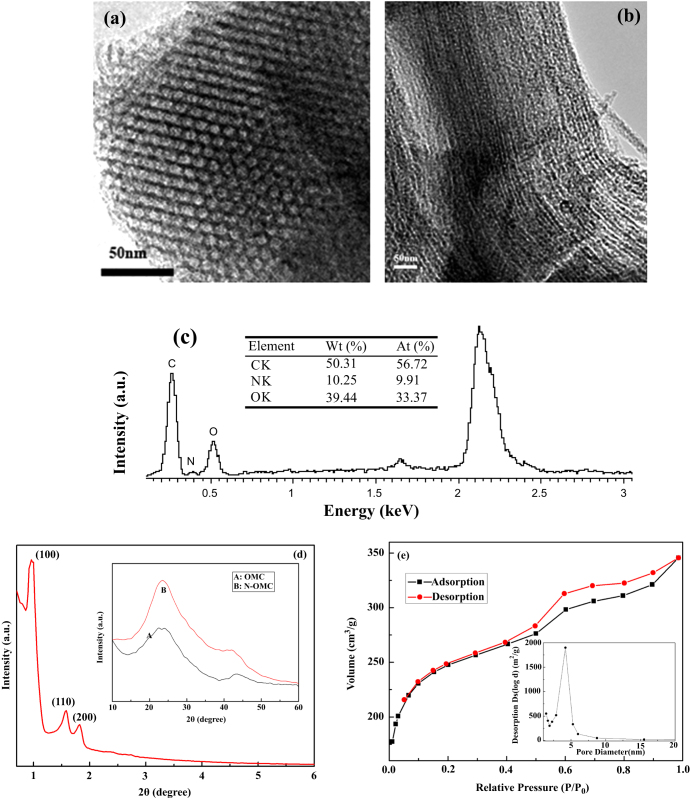
Figure 1.
TEM images of N-OMC taken (a) along and (b) perpendicular to the channel direction, (c) EDX graph of N-OMC, (d) XRD spectrum of N-OMC, and (e) nitrogen adsorption–desorption isotherm of N-OMC. Inset of figure 1(d): wide angle XRD patterns of OMC (A) and N-OMC (B).

