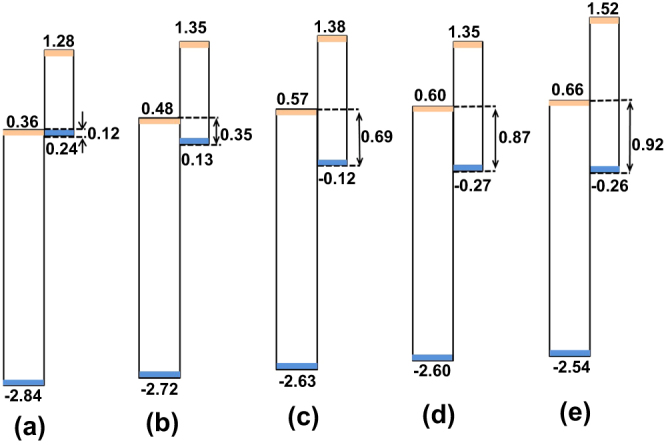
Figure 6.

Schematic representation of the band diagrams between TiO2 and SnS synthesized under different temperatures (a) 180 °C, (b) 150 °C, (c) 120 °C, (d) 90 °C, (e) 60 °C. The numbers marked near the double arrows are the difference between the CBM of TiO2 and the VBM of SnS.
