Figure 3.

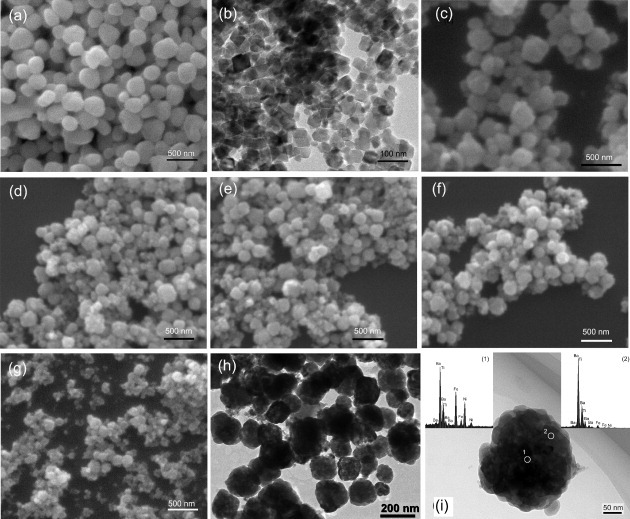
SEM images of (a) BaTiO3 particles, (b) NiFe2O4 particles and (c–g) C10–C50 nanocomposites; (h) TEM image of sample C20 and (i) EDS spectra acquired at positions 1 and 2 on a typical NiFe2O4@BaTiO3 nanoparticle.

SEM images of (a) BaTiO3 particles, (b) NiFe2O4 particles and (c–g) C10–C50 nanocomposites; (h) TEM image of sample C20 and (i) EDS spectra acquired at positions 1 and 2 on a typical NiFe2O4@BaTiO3 nanoparticle.