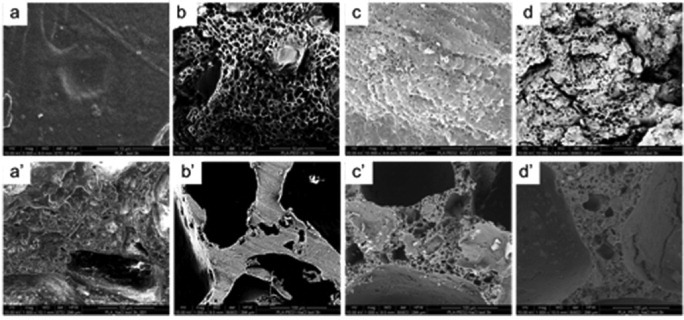
Figure 2.

SEM images of leached materials: (a) PLA, (b) PLA/PEG1, (c) PLA/PEG2, (d) PLA/PEG3, (a') PLA/NaCl (25/75), (b') PLA/PEG1/NaCl (20/5/75), (c') PLA/PEG2/NaCl (20/5/75) and (d') PLA/PEG3/NaCl (20/5/75). Scale bars are 10 μm for top row and 100 μm for the bottom row.
